| You should spend about 20 minutes on this task. The pie charts below illustrate the number of journal articles read per week by all students, PhD students, and junior lecturers at an Australian university. Summarize the information by selecting and reporting the main features, and make comparisons where relevant. Write at least 150 words. |
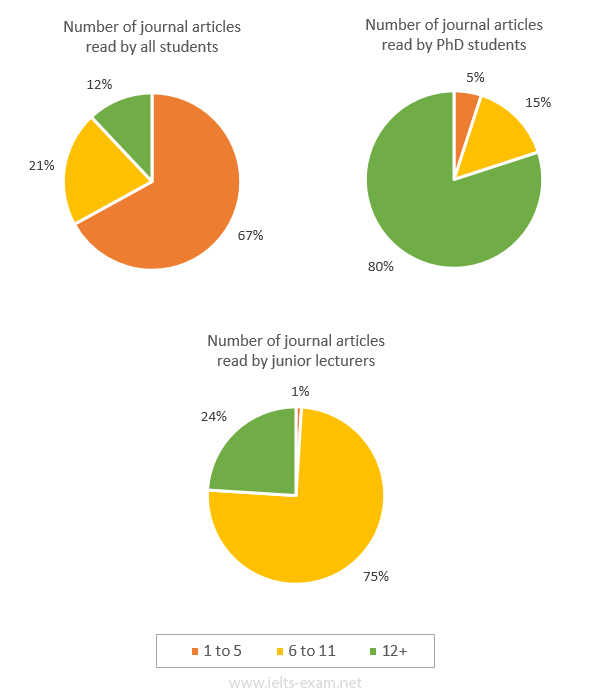
The pie charts illustrate the number of journal articles read per week by all students, PhD students, and junior lecturers at an Australian university.
Overall, PhD students read the highest number of articles, whereas the majority of all students read only a few journals each week. Junior lecturers fall in between these two groups, with most reading a moderate number of articles.
Among all students, 67% read just 1 to 5 journal articles weekly, while only 12% read more than 12. Around 21% read between 6 and 11 articles each week. In contrast, PhD students display the opposite pattern: the vast majority (80%) read more than 12 articles weekly, whereas only 5% read 1 to 5 journals.
For junior lecturers, three-quarters read 6 to 11 articles per week, and approximately 24% read more than 12. Very few, just 1%, read only 1 to 5 articles.
These data suggest that journal reading habits increase with academic experience, with PhD students being the most engaged, followed by junior lecturers, while general students tend to read relatively few journal articles.
1. Task Achievement (TA) – Band 7.5–8.0
Strengths:
- Covers all three groups (all students, PhD students, junior lecturers). ✅
- Clearly identifies overall trends and differences between groups. ✅
- Includes specific percentages to support comparisons. ✅
- Good overview provided: “PhD students read the highest number of articles…”
Weaknesses:
- Could highlight the contrast more explicitly with linking phrases like “in stark contrast” or “conversely.”
- No mention of smaller proportions for mid-range readers among PhD students; minor detail omitted.
Example Improvement:
- Original: “Around 21% read between 6 and 11 articles each week.”
- Revised: “By comparison, a smaller proportion of all students (21%) read a moderate number of journals, between 6 and 11 per week.”
2. Coherence and Cohesion (CC) – Band 7.0–7.5
Strengths:
- Logical progression: introduction → overview → details → conclusion. ✅
- Appropriate use of linking words: “whereas,” “while,” “in contrast.” ✅
Weaknesses:
- Some repetition in phrases like “articles per week” and “read,” which affects flow.
- Could use more variety in sentence structures for smoother reading: e.g., combining sentences with relative clauses.
Example Improvement:
- Original: “Very few, just 1%, read only 1 to 5 articles.”
- Revised: “Only a tiny fraction, 1%, read merely 1 to 5 articles, highlighting the strong reading habits of junior lecturers.”
3. Lexical Resource (LR) – Band 7.0
Strengths:
- Uses topic-specific vocabulary: “journal articles,” “weekly,” “academic experience,” “engaged.” ✅
- Words like “majority,” “approximately,” “vast majority” show range.
Weaknesses:
- Some repetition: “read” used excessively.
- Could include synonyms for variation: “peruse,” “consult,” “review.”
- Phrases like “falls in between” are slightly informal; “occupies an intermediate position” is more academic.
4. Grammatical Range and Accuracy (GRA) – Band 7.0–7.5
Strengths:
- Mostly correct subject-verb agreement: “PhD students display the opposite pattern.” ✅
- Correct use of comparative structures: “whereas,” “while.” ✅
Weaknesses:
- Sentence variety could be improved with complex structures: e.g., conditional or relative clauses.
- Minor tense consistency issues: “These data suggest” is correct, but could use plural verb for “data” consistently.
Example Improvement:
- Original: “Junior lecturers fall in between these two groups, with most reading a moderate number of articles.”
- Revised: “Occupying an intermediate position between the two extremes, junior lecturers predominantly read a moderate number of articles each week.”
Estimated Band Scores:
| Criterion | Band | Notes |
|---|---|---|
| Task Achievement | 7.5–8.0 | Covers all main features, good use of data, clear overview. |
| Coherence & Cohesion | 7.0–7.5 | Logical structure, minor repetition, limited complex sentences. |
| Lexical Resource | 7.0 | Good vocabulary, some repetition, limited formal synonyms. |
| Grammatical Range & Accuracy | 7.0–7.5 | Mostly correct, minor sentence variety limitations. |
Overall Band Estimate: 7.0–7.5