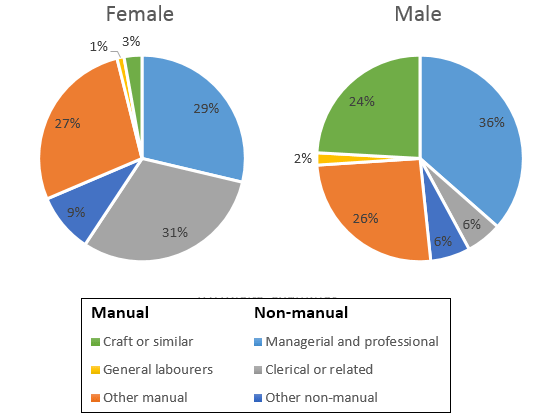
The two pie charts compare the distribution of male and female employment across six distinct manual and non-manual occupational categories in Great Britain in 1992, expressed as percentages.
Overall, men were more heavily represented in managerial, professional, and craft-related roles, while women dominated clerical, other manual, and other non-manual occupations. General labour was the least common occupation for women.
Managerial and professional positions were the most prevalent among men, accounting for 36% of male employment, compared with 29% for women. Crafts and similar occupations were also a significant area for men at 24%, far exceeding the 3% recorded for women. By contrast, clerical and related roles were the leading sector for women, comprising 31% of their workforce, more than triple the proportion for men.
Women also held slightly larger shares in other manual (27%) and other non-manual roles (9%) compared with men (26% and 6%, respectively). General labour, however, employed only 1% of women, making it the smallest category, while the male proportion was noticeably higher.
These patterns highlight a clear gender divide in occupational distribution, with men concentrated in higher-status and skilled manual roles, and women more engaged in clerical and other non-manual work.
Word Count: 174