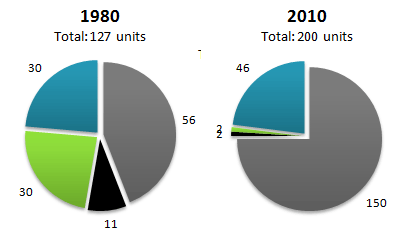
The charts compare the sources of electricity generation in New Zealand and Germany in 1980 and 2010. Over this period, total output rose from 127 to 200 units in New Zealand and from 107 to 214 units in Germany.
In 1980, coal was the dominant source in New Zealand, generating 56 units, while natural gas and hydro power each contributed 30 units. Petroleum played only a minor role at 11 units. By 2010, coal’s share had expanded significantly, supplying over three-quarters of total electricity, while hydro remained the only other major contributor at around 20%. All other sources had become negligible.
Germany’s energy profile in 1980 was more balanced. Coal and natural gas each produced 28 units, with petroleum and nuclear accounting for most of the remainder, and hydro contributing only 7 units. By 2010, however, the country had undergone a dramatic shift: nuclear power, absent from New Zealand’s mix, surged to become the dominant source, producing 155 units, or nearly three-quarters of total output. Coal and petroleum together supplied just 55 units, and other sources were minimal.
Overall, by 2010, the two countries relied on entirely different primary sources: coal in New Zealand and nuclear power in Germany.