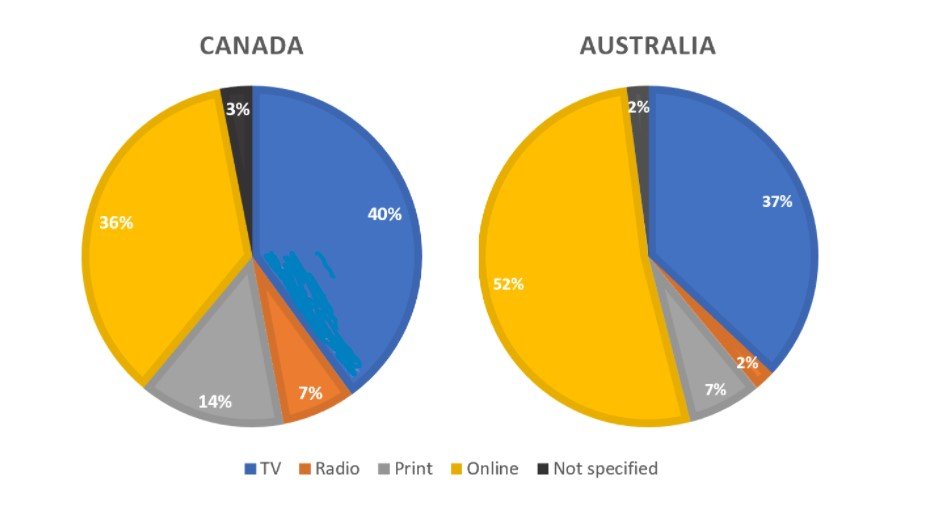
The two pie charts compare the proportions of people in Canada and Australia accessing news through various sources.
Overall, online platforms and television were the dominant means of obtaining news in both countries, whereas radio and unknown sources were the least utilised. Printed news occupied the third position in each nation, though with differing levels of popularity.
In Canada, television was the leading source, accounting for 40% of news access, closely followed by online platforms at 36%. Printed media represented 14%, while radio accounted for 7% and other unspecified sources just 3%.
By contrast, in Australia, online news held a clear lead at 52%, with television ranking second at 37%. The proportion relying on printed news was 7%, exactly half the Canadian figure. Radio and miscellaneous sources each accounted for 2%, indicating minimal reliance on these formats.
These figures suggest a stronger preference for digital news consumption in Australia, while Canada maintained a more balanced split between traditional and online media.