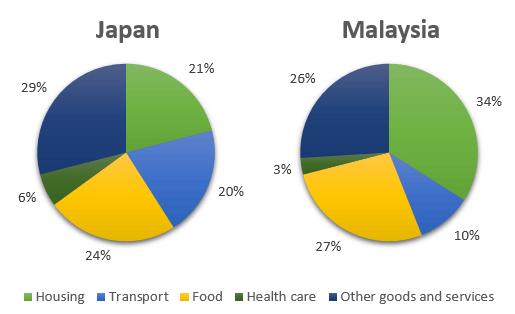
The two pie charts compare the percentage of household expenditure on various necessities in Malaysia and Japan in 2010. The figures are given in percentages.
Overall, in both countries, the largest proportions of spending were allocated to food, housing, and other goods and services, whereas health care accounted for the smallest share. Notably, housing dominated in Malaysia, while in Japan, the highest expenditure was on other goods and services.
In Malaysia, housing represented the greatest share of household spending at 34%, significantly higher than Japan’s 21%. In contrast, other goods and services were the leading category in Japan, comprising 29% of total expenditure, compared with 26% in Malaysia.
Food ranked second in Japan at 24%, while Malaysia allocated a slightly larger proportion at 27%. Transport was also a significant category in Japan at 20%, double the proportion in Malaysia (10%). In both countries, health care represented the lowest expenditure, making up only a small fraction of total spending.