Band 9 Model Answer
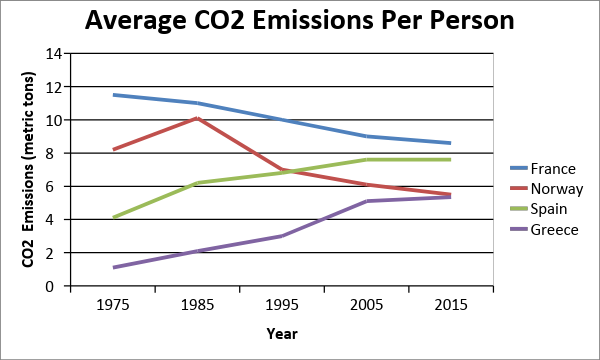
The chart compares the average carbon dioxide emissions per person in the United Kingdom, Sweden, Italy, and Portugal between 1967 and 2007.
Overall, the UK and Sweden experienced notable declines in per capita CO₂ emissions, while Italy and Portugal recorded substantial increases. Despite its downward trend, the UK consistently had the highest emissions throughout the period.
In 1967, the UK’s average stood at nearly 11 metric tonnes per person, the highest among the four nations. This figure fell steadily over the next four decades to about 9 metric tonnes by 2007. Sweden followed a different trajectory: emissions rose from around 9 metric tonnes in 1967 to a peak of almost 11 in 1977, before falling sharply to match Portugal’s level of 5.5 metric tonnes in 2007.
By contrast, Italy’s emissions nearly doubled, rising from just over 4 metric tonnes in 1967 to almost 8 in 2007. Portugal saw the most dramatic growth, with figures quadrupling from about 1.5 metric tonnes to 5.5, overtaking its initial position as the lowest emitter.
Paragraph 1 – Introduction (Paraphrase of task)
The chart compares the average carbon dioxide emissions per person in the United Kingdom, Sweden, Italy, and Portugal between 1967 and 2007.
Purpose: Introduces the topic, paraphrases the task statement without copying phrases directly, and states the time frame + units.
Paragraph 2 – Overview (General trends, no numbers)
Overall, the UK and Sweden experienced notable declines in per capita CO₂ emissions, while Italy and Portugal recorded substantial increases. Despite its downward trend, the UK consistently had the highest emissions throughout the period.
Purpose: Gives the “big picture” trends — this is what examiners want in the overview. No figures, just the main patterns and notable comparisons.
Paragraph 3 – First data group (Countries with declines)
In 1967, the UK’s average stood at nearly 11 metric tonnes per person, the highest among the four nations. This figure fell steadily over the next four decades to about 9 metric tonnes by 2007. Sweden followed a different trajectory: emissions rose from around 9 metric tonnes in 1967 to a peak of almost 11 in 1977, before falling sharply to match Portugal’s level of 5.5 metric tonnes in 2007.
Purpose: Covers countries with falling trends (UK + Sweden), linking them logically. Uses accurate numbers and varied trend language (fell steadily, rose to a peak, fell sharply).
Paragraph 4 – Second data group (Countries with increases)
By contrast, Italy’s emissions nearly doubled, rising from just over 4 metric tonnes in 1967 to almost 8 in 2007. Portugal saw the most dramatic growth, with figures quadrupling from about 1.5 metric tonnes to 5.5, overtaking its initial position as the lowest emitter.
Purpose: Covers countries with rising trends (Italy + Portugal), again grouped logically. Highlights the most striking change (Portugal saw the most dramatic growth).