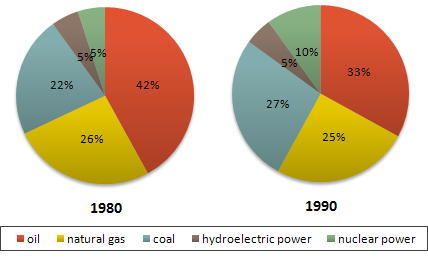
The pie charts illustrate the main sources of energy in the United States during the 1980s and 1990s.
Throughout both decades, oil remained the predominant energy source; however, its share declined alongside coal, while nuclear power’s contribution increased significantly.
In 1980, oil accounted for 42% of the total energy supply, making it the largest source. Natural gas was the second most important, providing 26%, followed by coal at just over 20%. Hydroelectric power and nuclear power each contributed 5%.
By 1990, nuclear power had doubled its share to 10%, becoming a more prominent energy source. Hydroelectric power remained stable at 5%. Coal and natural gas saw only minor fluctuations, maintaining similar proportions to the previous decade. Conversely, oil usage decreased to 33%, a drop of nearly 10 percentage points, but it still held the largest share of energy consumption.