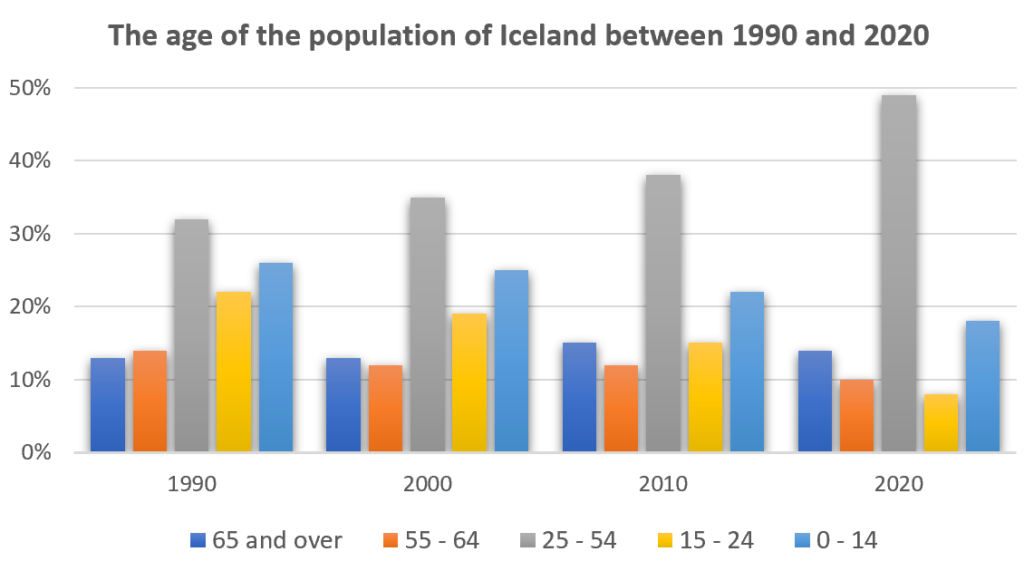
The bar chart illustrates the distribution of the population in Iceland across five age groups from 1990 to 2020.
Overall, the most significant change was observed in the 25–54 age group, which saw a considerable rise in its population share. In contrast, the younger age groups (0–14 and 15–24) experienced noticeable declines, while the proportions of older age groups remained relatively stable.
In 1990, the 25–54 age group accounted for roughly one-third of the population, but this figure rose sharply to nearly 50% by 2020, making it the largest demographic segment.
The 0–14 age group declined from slightly above 25% in 1990 to just under 20% in 2020. A more dramatic drop was seen in the 15–24 age group, which halved from just over 20% to just under 10% over the same period.
The 55–64 age group decreased modestly from 14% to about 10%, while the 65 and over age group remained relatively unchanged at approximately 13%.
1. Task Achievement (TA)
Strengths:
- Clear overview is given: “Overall, the most significant change was observed in the 25–54 age group…” ✅
- Data is selected and highlighted accurately: largest rise and notable declines are mentioned.
- Trends over time are clearly described: e.g., “The 15–24 age group…halved from just over 20% to just under 10%.”
Weaknesses:
- Lacks specific comparisons between multiple age groups at the same time: for example, comparing 0–14 vs 15–24 could be more explicit.
- No prediction or interpretation of the data (though not strictly required, it can strengthen a high band answer).
Example for improvement:
- “By 2020, the 25–54 age group accounted for nearly half of the population, while the 15–24 group shrank to less than one-fifth of its 1990 size, indicating a demographic shift toward an older working-age population.”
2. Coherence and Cohesion (CC)
Strengths:
- Logical structure: Introduction → Overview → Specific details ✅
- Linking words are used: “In contrast,” “while,” “but this figure rose sharply…”
Weaknesses:
- Some sentences could connect data more smoothly. For instance, instead of repeating “over the same period” multiple times, a variety of cohesive devices could be used.
- Limited sentence variety in linking trends: mostly “X increased/decreased from…to…”
Example for improvement:
- “While the 0–14 age group declined steadily, the 15–24 group experienced a sharper fall, which together contributed to a gradual aging of the population.”
3. Lexical Resource (LR)
Strengths:
- Good use of precise vocabulary: “distribution,” “population share,” “demographic segment,” “modestly.” ✅
- Some variety in verbs: “experienced,” “remained relatively stable,” “saw a considerable rise.”
Weaknesses:
- Could use more varied synonyms for “increase” and “decrease”: e.g., “rose sharply,” “declined,” “dipped,” “plummeted,” “remained steady.”
- Some phrases are repetitive: “just under/over…” could be replaced with alternatives: “approximately,” “around,” “nearly.”
Example for improvement:
- “The 0–14 age group contracted to around 20%, whereas the 25–54 segment expanded substantially, reaching nearly half of the total population.”
4. Grammatical Range and Accuracy (GRA)
Strengths:
- Correct use of past tense and past continuous forms: “declined from…to…,” “was observed.” ✅
- Complex sentences are attempted: “while the proportions of older age groups remained relatively stable.”
Weaknesses:
- Limited variety of complex sentence structures: mostly simple past tense + “while/but.”
- Passive constructions could be added for variety: “the largest demographic segment was recorded in the 25–54 age group by 2020.”
- Few conditional or comparative forms that could strengthen high-band answers.
Example for improvement:
- “Although the 55–64 age group decreased slightly, the 65+ group remained virtually unchanged, highlighting the stability of the elderly population segment.”