| The table and bar chart show how journey times in a city centre changed after improvements were made to the transport network, and the cots of using different form of transport in the city. Summarise the information by selecting and reporting the main features, and make comparisons where relevant. |
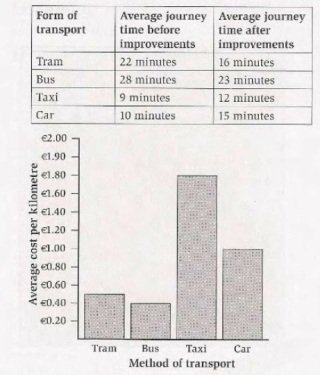
The table illustrates the average journey times to travel around a city before and after improvements to the transport network, while the bar graph presents the cost per kilometre for different modes of transport.
Overall, taxis remained the fastest mode of transport, taking 9 minutes before and 12 minutes after the network enhancements. Cars experienced the largest increase in journey times, rising from 10 minutes to 15 minutes. Conversely, buses, which were the slowest form of transport initially, saw a reduction in travel time from 28 minutes to 23 minutes following the improvements. The tram witnessed the most significant decrease, falling from 22 minutes to 16 minutes.
Regarding cost, taxi fares were the highest, at €1.80 per kilometre, followed by cars at €1.00. Trams were relatively affordable, costing €0.50 per kilometre, while buses were the cheapest option, at just €0.40 per kilometre. In conclusion, depending on distance and budget, taxis offer the quickest but most expensive journey, whereas buses provide the most economical means of travel.