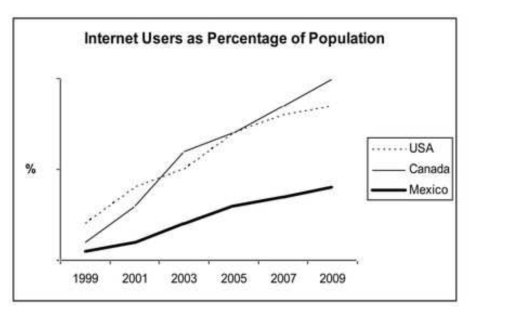
The given line graph illustrates the proportion of people in Canada, the USA, and Mexico who accessed the Internet between 1999 and 2009.
Overall, Internet usage rose consistently in all three countries throughout the period, with Canada experiencing the most dramatic growth, while Mexico remained the least connected. By the end of the decade, nearly the entire Canadian population was online, in sharp contrast to Mexico.
In 1999, Internet penetration was highest in the USA at around one-fifth of the population, double the figure in Canada and four times that in Mexico. Over the next three years, usage in both the USA and Canada climbed rapidly, reaching approximately 40% by 2002, whereas Mexico lagged behind at just above 10%.
After 2002, Canada’s growth accelerated and, by 2005, around 70% of Canadians were Internet users, a rate slightly above that of the USA. In Mexico, however, the figure was still modest, at only about a quarter. By 2009, Canada had almost universal access at close to 100%, while the USA plateaued at roughly 80% and Mexico remained comparatively low at just 40%.