You should spend about 20 minutes on this task.
| The charts below show the average percentages in typical meals of three types of nutrients, all of which may be unhealthy if eaten too much. |
Summarize the information by selecting and reporting the main features, and make comparisons where relevant.
You should write at least 150 words.
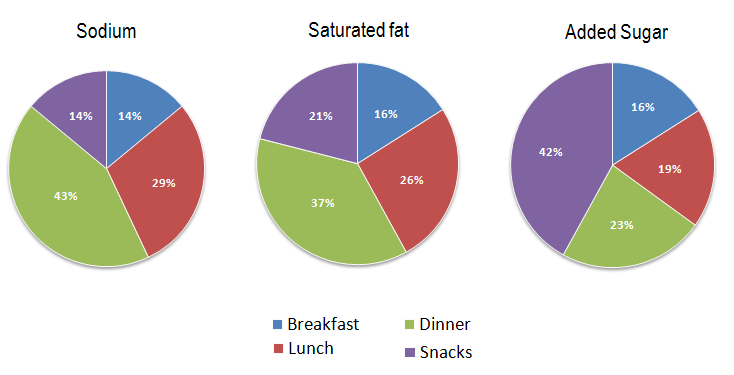
The pie charts illustrate the proportions of sodium, saturated fats, and added sugar in four typical daily meals consumed by Americans. The data highlight the nutrient content in breakfast, lunch, dinner, and snacks, which, if consumed in excess, may be detrimental to health.
Overall, lunches and dinners contribute the most to sodium and saturated fat intake, whereas snacks are the primary source of added sugar in the American diet. Breakfast contains relatively low levels of all three nutrients, with sodium, sugar, and saturated fats each accounting for approximately 14–16%.
During lunch, Americans consume higher amounts of these nutrients, with sodium making up 29%, saturated fats 26%, and sugar around 20% of their daily intake. Dinner is even richer, providing 43% of sodium, 37% of saturated fats, and 23% of sugar, making it the most significant contributor to unhealthy nutrient consumption.
Snacks stand out for their sugar content, which reaches 42%, surpassing both lunch and dinner, while saturated fats account for 21%. Sodium intake during snacking is comparatively low. This pattern indicates that Americans obtain the bulk of harmful nutrients from main meals and sugar-heavy snacks.