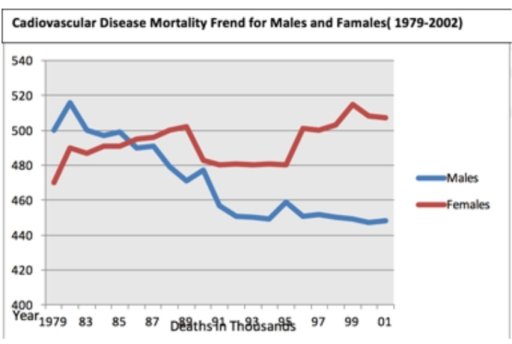
Level 1: The line graph displays the number of deaths caused by cardiovascular disease for males and females in the United States.
Generally, there are big differences in the mortality trends for men and women. In 1979, more males died than females of cardiovascular disease. There are 500,000 male deaths and 470,000 female deaths in this year. In 2001, much more females died of cardiovascular disease than men.
For men, from 1979 to 1981, the number of deaths of cardiovascular disease increased slightly and from 1981 until the end of the period surveyed, it decreased strongly and followed an elastic trend. Noticeably, in 1993, few people died of this disease. After this year, the statistic rose mildly however after that, it continued to fall.
For women, the trend fluctuated more significantly. The number of female deaths increased in the first 10 years, then decreased from 1988 to 1991, then increased again in the remaining period.
Level 2: The line graph shows how many males and females were killed by cardiovascular disease in the United States.
Overall, there are big discrepancies in the mortality trends for men and women.
In 1979, more cases of males than females were reported dead of cardiovascular disease, with 500,000 and approximately 470,000 cases, respectively. The number of deaths for both genders experienced an upward trend from 1979 to 1981 before declining slightly during the next two years. From that time on, cardiovascular diseases provoked fewer and fewer cases of deaths for male patients. The most significant decrease was recorded in the period from 1989 to 1993 during such time the lowest figure was recorded at only 440,000 in the year 1993.
Regarding female mortality, the trend was much more complex, with abrupt increases and decreases. In the final year of the survey – 2001, the death toll for female patients was nearly 500,000, which is considerably higher than that of males.